We looked at teams’ forms at the end of the previous season and performed our own fixture analysis. Which teams have the best offense? And which teams have the best defense? You will find it in this analysis.
Data from 2020/21 season
We were monitoring a number of metrics for each team throughout the whole season. Generally, they are based on the last 6 matches of each team. We produced 7 percentiles of various ranges from the worst to the best and assigned a color each. Data from each match was provided by understat.com and aggregated by us.

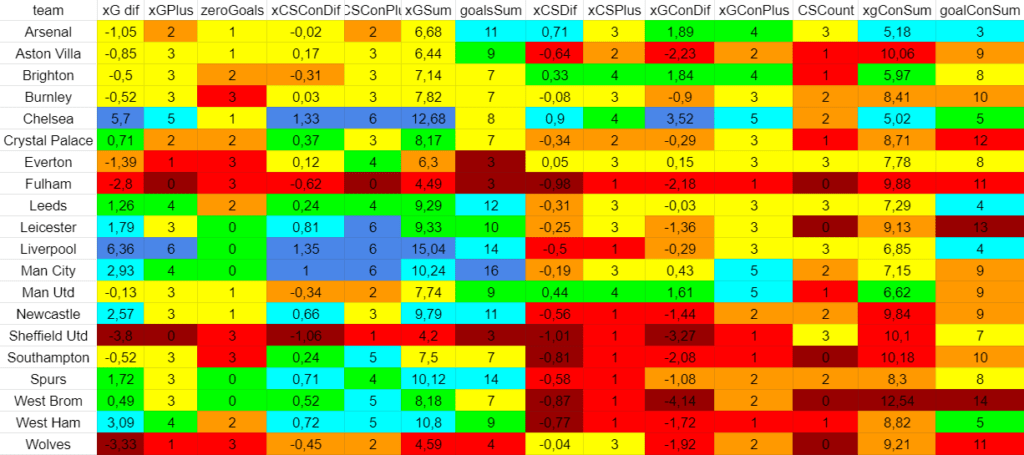
A few words about table’s columns:
- xG dif: accumulated sum of differentials between this team’s xG in a given match and average xG conceded of the opponent team
- xGPlus: number of matches with xG dif greater than zero
- xCSConDif: accumulated sum of differentials between this team’s opponent xCS in a given match and their average
- xCSConPlus: number of matches with xCSConDif greater than zero
- 0 goals: number of matches with zero goals scored
- xGSum: total xG for matches
- goalsSum: total goals count
- xCSDif: accumulated sum of differentials between this team’s xCS in a given match and average xCS of the opponents of this match opponent
- xCSPlus: number of matches with xCSDif greater than zero
- xGConDif: accumulated sum of differentials between this team’s xG conceded in a given match and average xG conceded of the opponents of this match opponent
- xGConPlus: number of matches with xGConDif greater than zero
- xGConSum: total xG conceded for matches
- goalConSum: total goals conceded
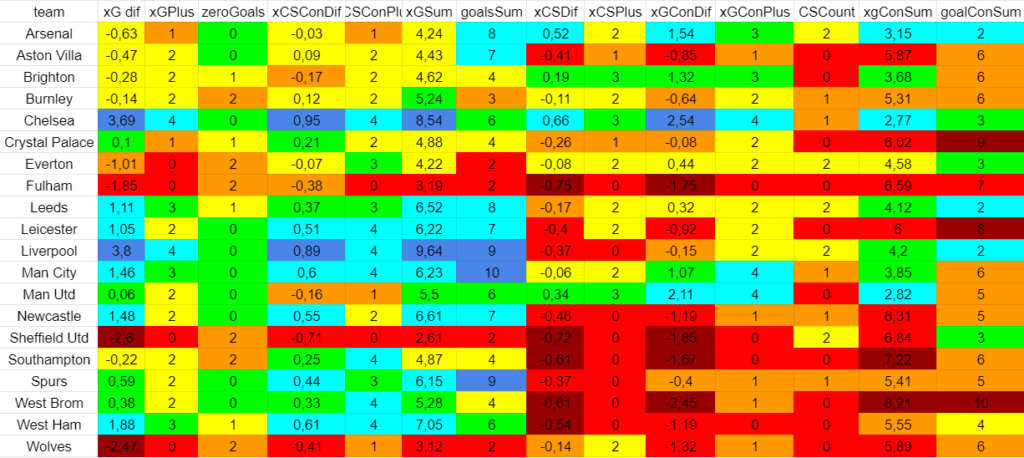
Also, it often happens that a team has an unexpectedly great or awful match that does not show their real form. So, we simultaneously create another table based on the last 6 games but without one best and one worst match.
Attacking and defensive strength of each team
It is quite hard to contemplate tables this big, so we simplify them and narrow them to just 2 columns for attacking stats and defensive stats.
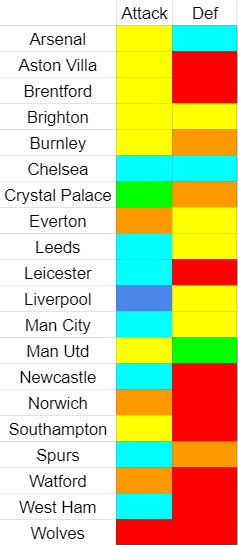
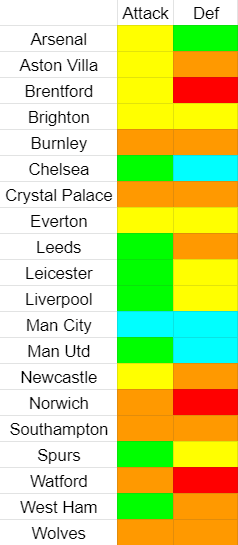
As you might have noticed, we replaced relegated teams with newcomers Brentford, Norwich, and Watford. Generally, new teams are awful defensively and are slightly worse in attack, comparing to EPL standards. Brentford got a ‘yellow’ attack, because Championship winners tend to start new EPL season with quite some goals count. But be aware that these are just assumptions and we will gather more information as the season progresses.
Also, it is important to note that these are just the last 6 gameweeks strengths for each team, but their form has definitely changed since the end of the season. We were also monitoring the form of each team, measuring how the team’s stats compare to their previous results, particularly how many of the previous results are worse than current.
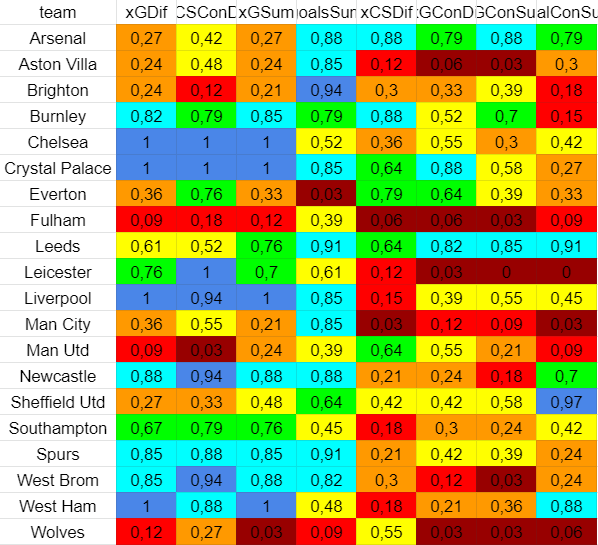
And we also convert this table to the simple one with just two colors.
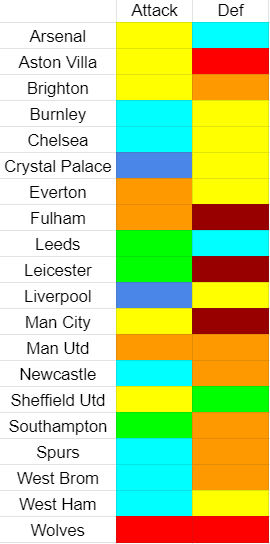
Knowing forms of teams at the end of the season we can slightly alter their strengths to get an ‘average strength’ for each team.
Conclusion
Now we have some kind of a baseline for the start of the new season based on the end of the previous one. We can take a look at the first few fixtures so it might help us determine what teams we should target at the start of the season.
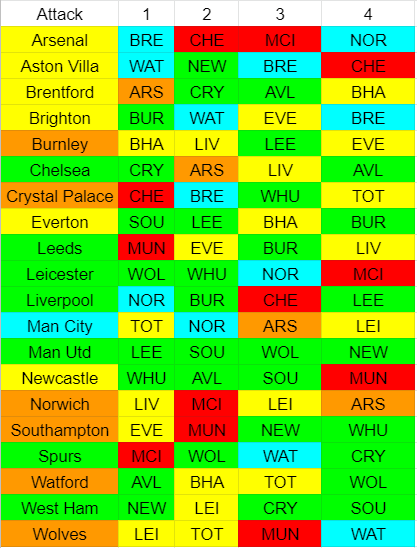
Here we have several types of teams:
- Good attack and good fixtures: Man United and West Ham.
- Good attack and mixed or average fixtures: Chelsea, Leeds, Leicester, Liverpool, Man City, Spurs.
- Average attack and good fixtures: Brighton and Everton.
- Average attack and mixed or average fixtures: Arsenal, Aston Villa, Brentford, Newcastle.
- Below average attack and good fixtures: only Watford.
- Below average attack and mixed or average fixtures: Burnley, Crystal Palace, Southampton, Wolves.
- Below average attack and bad fixtures: Norwich.
It is advisable to take a majority of your team from the first three groups with maybe a minority of some players from groups 4 and 5.
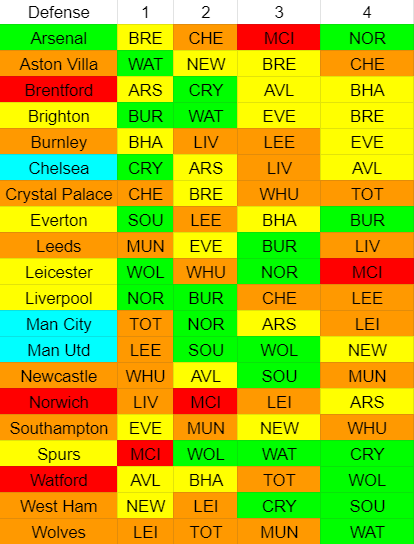
Similarly, here are the groups for defense:
- Great defense with average fixtures: Chelsea, Man City, Man Utd
- Average defense with good fixtures: Brighton, Everton
- Average defense with average or mixed fixtures: Leicester, Liverpool, Spurs, Arsenal
- Below average defense with mixed fixtures: Aston Villa, Leeds, Newcastle, West Ham
- Below average defense with bad fixtures: Burnley, Crystal Palace, Southampton, Wolves
- Bad defense: Brentford, Norwich, Watford
It is generally good to have at least some great defensive options in your team, but it is hard to know for sure at the start of the season, so one should look at attacking defenders in attacking teams with a chance for a clean sheet. Also, it is worth pointing out that Brentford has an OK fixture run, so they might be an option to consider.
What’s next
We plan to write about specific players that you should bring to your squad before GW1 and share possible drafts with explanations and thoughts on choices made.


")
Amazing work, thank you
I will going straight to ask, what kind of draft do you suggest to start this new season? show us please 🙂
Sure, our new material is coming soon!
One of our future posts will contain possible drafts to start the season with