In my statistical research I focused on flat track bully features in the Fantasy Premier League.
I investigated whether players’s FPL points are depended on the fixture and I found surprising results.
Guide to the Flat Track Bully Index article
Form over fixture or fixture over form?
This is very common question in Fantasy Premier League community among FPL managers.
Some of them have maybe figured it out and some of them haven’t. Personally, I belong to the second group.
Many of us have that soft voice in our head which silently whispers before every transfer we make:
„Fixture over form. Of course fixtures do matter. It is higher probability that player will score against weak opponent than tough one. Even bookies odds favour player to score more against easier side… It is logical.“
So we load up our teams with players who have the best fixtures and they just blank. Disappointed and frustrated we transfer them out because their fixtures are turning to the sea of grey and red.
And in their very first match, when they are no longer in our teams, they score. It doesn’t happen every time, but it happens more often than we like.
When it happens to me, I always ask myself questions: „Could I see that coming? Could I predict, that it was going to happen?“ I’ve never had a clear answer to that.
But when Sigurdsson scored and assisted against Manchester United, right after his blank against Fulham back in 2019/20 season, I decided to make some statistical research.
I wanted to explore whether there really is a relation between player’s fixtures and his FPL points. Basically, I was researching a flat track bully features in the FPL.
Dependence of FPL points on the fixture
First, I want to thank two people. This research would not be possible without Vaastav’s data from github, thank you.
And I want to thank Sean McColl for making up cool name to my research – a Flat Track Bully Index.
Correlation coefficient - a core of the Flat Track Bully Index
In order to investigate the dependence, I used a simple statistical tool called correlation coefficient. The coefficient measures strength of the relationship between two variables. It gains values between -1 and 1.
If correlation coefficient gains value 1, it means that there is perfect positive dependence between two variables and that variables move in the same direction.
On the opposite, if the correlation coefficient is -1, it means that there is perfect negative dependence between two variables, and that variables move in the opposite direction.
It can also be zero which means that there is no dependence between variables. If it is something between, let’s say 0.738, it means there is a positive dependence between variables (but not perfect).
The higher the absolute value of the correlation coefficient, the higher the strength of the relationship between variables.
Correlation between FPL points and FDR
In my research, I took two FPL variables: FPL points of a player in matches and a Fixture difficulty ranking (FDR) of these matches. I had gathered data about FPL points and FDR from 2016/17, 2017/18 and 2018/19 seasons.
Then I started to investigating whether there is a positive, negative or no dependence between those two variables.
Just to remind you, FDR gains values 1,2,3,4 or 5 (1 – very easy, 5 – very difficult). I took 30 highest scoring players from FPL 2018/19 season (because I needed players who were actually scoring points).
Then I calculated correlation coefficient between FPL points and -1* FDR for every one of them.
My goal was to explore whether an easier match means more points for a player. I used -1*FDR instead of just FDR only because I wanted the higher number of fixture ranking meant the easier fixture (because of the sign of the correlation coefficient).
I calculated it only for matches where a player played more or equal than 60 minutes. We may call this correlation coefficient a Flat Track Bully Index. In the picture below, you can see my results:
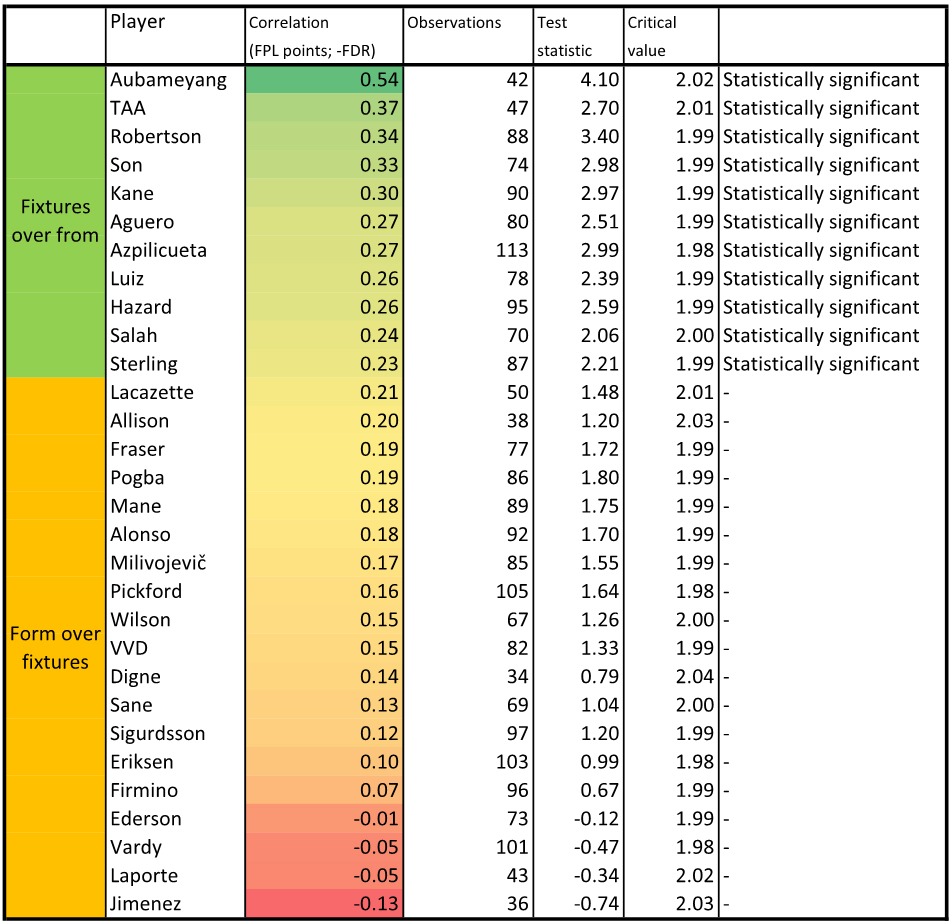
Table 1: Flat Track Bully Index
Interpretation of results of flat track bully features in FPL
Players in the table are sorted by the highest value of the correlation coefficient. Those with high value of the coefficient were scoring better in easier fixtures.
Those with the coefficient close to the zero scored well or bad regardless the fixtures. And players with very negative value (almost no one) scored better in tougher fixtures.
My calculations were made only from data from all Premier League matches from three seasons (2016/17, 2017/18 and 2018/19).
So, the correlation was calculated only from this small sample and not from the whole statistical population.
The whole statistical poppulation would be all matches that selected players played and will play in their career.
However, we want to use the Flat Track Bully Index to help us pick players to our FPL teams. We know fixtures and we want to decide whether someone is a good pick even if he has bad fixtures, or he is good pick only during the run of good fixtures.
We need to generalize the result from the three year sample to the whole statistical population (all matches that a player played or will play).
That is why I tested statistical hypotheses about a significance of these correlation coefficients.
Testing hypotheses about the Flat Track Bully Index
1. Formulation of hypotheses
When statistically testing the Flat Track Bully Index, I formulated two hypotheses (H0 and H1) about the correlation coefficient of every player:
- H0: Correlation coefficient = 0 (there is no dependence between fixtures and player’s points on the significance level of 0,05).
- H1: Correlation coefficient < > 0 (there is a dependence between fixtures and player’s points on the significance level of 0,05).
These hypotheses needed to be formulated and tested because there is a possibility that an observed correlation (on data sample from last three season) occurred due the sampling error.
It means, for example, that despite non zero correlation in the three year sample, there may be zero dependence in the whole statistical population (in all matches in player’s career).
2. Types of possible errors in the process of generalizing results
When we want to generalize results about the dependence from this sample on the whole population (all matches), two errors may occur:
- Type I error (if we reject true null hypothesis H0 – if we come to the conclusion that there is a dependence between player’s points and fixtures, but in fact there is no dependence).
- Type II error (if we don’t reject false null hypothesis H0 – if we come to the conclusion that there is no dependence between player’s points and fixtures, but in fact there is a dependence).
3. Results from hypothesis testing
Statistically significant dependence
I tested the Flat Track Bully Index and calculated test statistics (5th column of the Table 1) of the correlation coefficient of every player.
If the absolute value of the test statistic is higher than the critical value (6th column of the Table 1), we reject H0 on the significance level of 0,05.
It means that there is sufficient evidence that there is a significant dependence between player’s points and his fixtures. The correlation coefficient is significantly different from zero.
In this case, we may use the knowledge from the Table 1 and predict that players with positive and statistically significant correlation coefficient will do better in easier fixtures rather than tough ones.
These are “fixtures over form” players. However, there is still a possibility of an error.
Specifically, there is 5% probability (because of 0,05 significance level) that we are wrong and in fact there is no dependence between player’s points and his fixtures. It would be the type one error.
Statistically insignificant dependence
If the absolute value of the test statistic is less than the critical value, we do not reject H0. It means, that there is insufficient evidence that there is a significant dependence between player’s points and his fixtures.
The correlation coefficient is not significantly different from zero.
For players with statistically insignificant correlation coefficient there is insufficient evidence that there is a dependence between their points and fixtures.
Those players may do well (or bad) in all kind of fixtures.
They are “fixture-proof“ what is a double-edged sword. They are able to do really well in tough fixtures, but also to blank in easier ones.
The use of Flat Track Bully Index
We may use knowledge from this research from Table 1 in planning our FPL teams based on fixtures.
Flat Track Bully Indexes (correlation coefficients) of players in green are statistically significant and there is very high probability that they will do better in easier fixtures rather than tougher.
However, it doesn’t mean that those players won’t score in tough fixtures. They will just do better in easier ones. There is still 5% risk that this conclusion is incorrect.
In my opinion, 5% probability is really low and the Flat Track Bully Index can be a powerful instrument to give us an edge over other FPL managers.
Last words for FPL managers about the research
In conclusion… Calculations in this research were made on a significance level of 0,05. It is commonly used number among statisticians. With other significance level (0,01; 0.04; 0.06; 0.1…) results would be different.
That is why making the line in the Table 1 between Sterling and Lacazette in order to divide players into two groups is not the wisest solution.
That’s why you should not look at the table just as a two groups of players, and you should take into account other factors. For example:
- Value of the correlation coefficient: in Aubameyang’s case, his Flat Track Bully Index is more than twice as high as Sterling’s. Should the conclusion for both of them be the same?
- Number of observation: for Jimenez the index was calculated from 36 matches, for Azpilicueta from 113.
- Age: three seasons ago, Sane was 20 years old, and since then he has developed into much better player with more regular returns. That could distort the value of his Flat Track Bully Index.
- Other factors like changing club, position etc.
Flat Track Bully Indexes – correlation coefficients calculated from the sample (three Premier League seasons) are point estimations of correlation coefficients of the whole statistical population (all matches player played and will play).
We could go deeper and calculate an interval estimations of correlation coefficients of whole population. That would give us even a bigger picture on the dependence between player’s points and his fixtures.
Sources
- Official FPL
- ANDĚL, Jiří. Matematická statistika. 2 vyd. Praha : SNTL, 1978. s. 346.


")
Hi Matej,
just find your website and it is very good and interesting, I like how you use scientific methods and mathematics calculations for predictions and strategies.
This Flat Track Bully Index is very fascinating, and I think you should do it again with new updated data, for seasons 2019/20, 20/21, and 21/22 so that we have a clearer view on some players.
And your analysis did produce one 100% correct myth, and that is that Vardy is fixture proof player, and we all know that he likes to score against big teams. It would be interesting to see results combined with last 3 seasons.